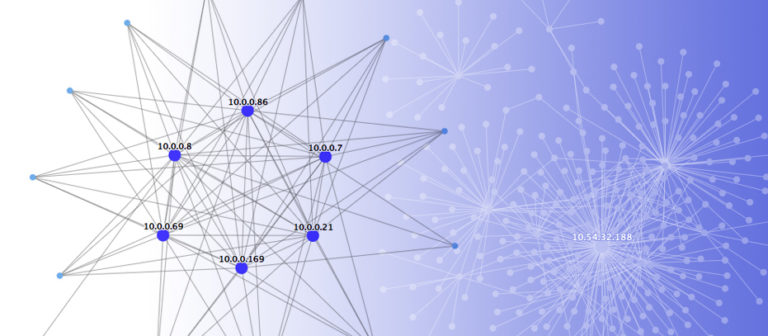
We’ve just released a new feature in our ActiveEye platform that lets you visualize network activity in Amazon virtual private clouds (VPCs). In today’s blog we’ll discuss why we developed this capability. We will also explain how you can use it to detect potential security threats faster.
DevOps teams are rapidly deploying applications to cloud environments. We often work with security professionals who are struggling to keep pace with them and make sure that data and access to these new environments are secured. This new feature is designed to help both identify risks and reduce the time it takes to investigate them.
Amazon VPCs allow DevOps teams to deploy new applications quickly and securely via private clouds hosted on the Amazon Web Services (AWS) Cloud. But maintaining the security of the data and apps on VPCs is up to the people using them. This includes software development engineers, product teams, and of course, the security group.
The Problem: Lack of Visibility into Network Traffic and AWS Cloud
We’ve worked with many of our clients to securely move their applications and business operations to cloud infrastructure. As DevOps deploys applications in AWS environments, however, it’s often hard for security teams to see what’s running in them. To address this problem, we’ve developed a number of tools in the past few years to provide better insights into the creation and management of AWS services.
One problem that remained elusive, though, was an easy way to see how network traffic was flowing between them. We wanted to make it simple to see what communication was actually taking place between AWS resources. We also wanted to show which applications were being accessed on EC2 instances, and which were being accessed from external IP addresses.
The data to answer these questions is available in the VPC Flow Logs. However, getting meaningful insight from the millions or billions of records created daily was nearly impossible. You’d have to set up and configure multiple other AWS tools like CloudWatch, Amazon Kinesis, and Amazon Athena. This was a big hurdle for DevOps and security teams, and understandably, most didn’t have the time or inclination to do this.
The Solution: VPC Flow Log Visualization
VPC Flow Log Visualization gives you real-time insights into IP traffic going to and from VPCs. It also shows traffic from networks and the Internet, and lets you label applications in use. As a result, you can quickly identify risky configurations, investigate errors, and detect potential threats.
The visualization tool maps IP address communication between nodes. It also allows you to filter traffic by application type, internal versus external sources, and accepted or rejected flows. External traffic flows are clearly identified with different colored nodes. This makes it much simpler for SOC managers, solutions architects, support engineers and anyone else using these environments to see what’s happening.
Summary
Native AWS tools like VPC Flow Logs let you capture traffic going to and from network interfaces. Each network interface has a unique network log stream, though. This can make it difficult to use that data effectively for security monitoring. Our Flow Log Visualization for Amazon VPC gives you real-time insights quickly and easily for better network security and AWS security.
The new visualization feature complements our other security services for AWS. These include AWS Configuration Assessment, AWS CloudTrail Log Analysis and Storage, and AWS GuardDuty Analysis and Aggregation.
If you’re interested in solving complex challenges like this, we are currently hiring software development engineers and senior cloud engineers. Visit our Careers page to learn more about open positions.
